Regulatory Data:
A Trove of Valuable Bank Information
(Originally Published October 2019)

“First-level thinkers look for simple formulas and easy answers. Second-level thinkers know that success in investing is the antithesis of simple...Your thinking has to be better than that of others...you must find an edge they don’t have. You must think of something they haven’t thought of, see things they miss or bring insight they don’t possess.” – Howard Marks
At Prospector Partners, we utilize regulatory filings and alternative data in addition to traditional SEC/GAAP filings and statements. This is especially the case when it comes to the bank sector as we make use of call reports filed to the FDIC and financial statements filed to the Federal Reserve.
Why?
If you are willing to invest the time and energy (along with learning how to interpret them), regulatory filings can reveal a trove of valuable information. Many investors, especially generalists, do not make adequate use of non-traditional filings in the investment process. We utilize regulatory filings for greater insight into the balance sheet, the branch footprint, M&A potential, and the income statement.
Balance Sheet Detectives
Loan Type Detail
Your typical 10-K, 10-Q, or investor presentation provides limited insight into the loan book. By relying on traditional filings alone, an investor may believe a loan book is of average or low risk. Using regulatory statements, we occasionally discover exposure to higher-risk loan categories. As a result, we avoid investing in banks which are above our desired risk profile. While high risk loan books produce attractive returns in good times, they are a leading cause of large and permanent loss when the credit environment turns.
Derivatives Exposure
Solely utilizing SEC statements, an investor can overlook these key risk exposures. Meanwhile, the bank in question may be holding large amounts of credit derivatives, opaque financial instruments, and off balance sheet holdings/commitments. During the Financial Crisis, such exposures were responsible for the downfall of many banks – thus, we take the time to analyze these financial instruments.
Capital Composition and Adequacy
Through regulatory disclosures, we obtain a better understanding of the composition and quality of regulatory capital. We favor banks with a healthy composition of excess regulatory capital as “insurance” against a credit environment downturn. These banks also often utilize excess capital to repurchase shares at attractive valuations. Additionally, higher capital levels tend to make the banks more desirable from an M&A standpoint.
Securities Detail
These alternative filings provide immense detail regarding on-balance sheet securities. Banks today generally hold high quality and “vanilla” securities, though we still analyze their secu- rities portfolio to leave no stone unturned.
Branch Footprint and M&A Potential
Evaluating the Branch Footprint
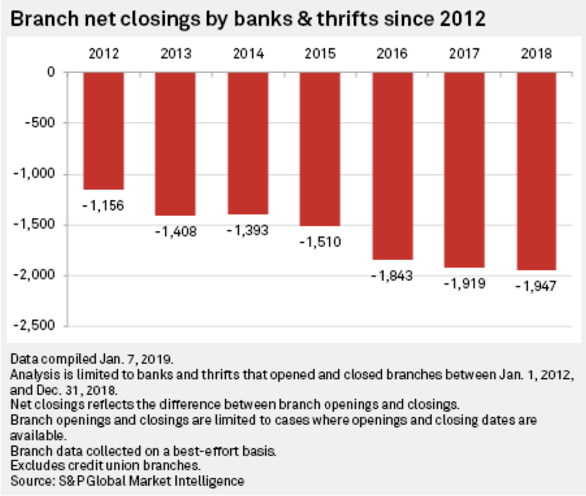
We also use non-traditional data for the purposes of branch mapping and modeling. As each day passes, digital banking becomes more popular and the need for traditional brick and mortar branches declines. As a result, banks are closing branches at a record pace in order to achieve expense saves as seen in the chart below. This is a major tailwind for the overall sector and earnings growth.

We analyze a bank’s footprint using alternative data to determine how many branches can be consolidated based on a variety of factors including performance metrics and proximity to the next closest branch. Branch consolidations can result in meaningful expense saves which can drive a stock price higher.
As an example, we researched a regional bank that was disliked by investors and traded at a cheap valuation given lackluster performance. We constructed a branch analysis which concluded the bank could consolidate a significant portion of its footprint. Along with other expense save opportunities, our analysis indicated the bank could beat consensus forward EPS estimates by ~20%. Eventually the bank announced a wave of branch closures along with additional expense initiatives which resulted in significant stock price gains.
Determining M&A Targets
In the investment process, we estimate private market value by determining what a competitor would pay for the bank. We do this via meticulous modeling of hypothetical M&A scenarios – similar to what an investment banker would do in the process of pitching a combination of two banks. A key driver in determining private market value for banks arises from the expected cost saves as a result of duplicative branch overlap between two banks. We utilize alternative data to determine the potential for branch closures (i.e. expense synergies) in an M&A scenario.
A real world example is a community bank we invested in located in the Northeast. While not particularly appealing to most investors, we were attracted to the potential for M&A. After a deep dive into the branch footprint and the overlap of key competitors, we modeled scenarios where the bank could be purchased at a significant premium by multiple banks due to meaningful branch consolidation opportunities. Ultimately, the bank was bought by a large regional competitor at a healthy 20%+ premium to the market price at announcement.
Non-Performing Assets and Loan Losses
Regulatory filings can be used to gauge asset quality. These filings provide insight into the composition of a bank’s non-performing loans along with the associated allowance against losses and loan loss activity. This level of detail enables us to have in-depth conversations with management on the state of credit quality. Such conversations are instrumental in the process of deciding when to invest or reduce/exit an existing holding. While asset quality remains pristine today, there will come a day when the cycle turns and this step becomes the most crucial aspect of the investing process.
Income Statement Detectives
Cost Save Potential
Regulatory statements provide a detailed and standardized view of the expense base. This allows us to compare the expense base of the bank in question with its peer group. This can reveal the bank is overspending on one or multiple line items which represents a potential cost save opportunity, thus aiding the bottom line.
Fee Income
At times, traditional statements provide a limited view of noninterest related income. In our opinion, not all noninterest income is created equal. Income from underwriting, investment banking, trading, securities brokerage, private equity, and mortgage banking are volatile in nature and should be discounted. Meanwhile, income from wealth management, trust, and servicing fees tend to be stable and recurring. Understanding the noninterest income profile is essential to the degree of value we assign to such earnings.
Looking for more research?
Download our whitepaper, Statutory Data: A Look Under the Hood of an Insurance Company.
The views described herein do not constitute investment advice, are not a guarantee of future performance, and are not intended as an offer or solicitation with respect to the purchase or sale of any security. Investing involves risk, including loss of principal. Investors should consider the investment objective, risks, charges and expenses of a Fund carefully before investing. Please review the offering memorandum or prospectus of a Fund for a complete discussion of the Fund’s risks which include, but are not limited to: possible loss of principal amount invested; stock market risk; value risk; interest rate risk; income risk; credit risk; foreign securities risk; currency risk and derivatives risk.
Nothing contained herein constitutes investment, legal, tax, or other advice nor should be relied upon in making an investment or other decision. Any projections, outlooks or estimates contained herein are forward looking statements based upon specific assumptions and should not be construed as indicative of any actual events that have occurred or may occur.


